CandelaCharts - Oscillator Concepts 📝 Overview
Oscillator Concepts shows a single, easy‑to‑read line on a scale from −1 to +1 . Near 0 means balance; beyond +1 or −1 means the move is stretched. You can add helpful layers like trend stripes, participation shading, volatility markers, calendar dividers, divergence tags, and simple signal markers. Pick a trading profile (Scalping / Day Trade / Swing / Investment) and the lengths update for you.
📦 Features
A quick tour of the visual layers you can enable. Use this to decide which parts to turn on for reading momentum, extremes, trend bias, participation, and volatility at a glance.
The Line (−1…+1) : A clean momentum read with an optional EMA smooth and clear 0 / ±1 guides.
OS/OB Visualization : Soft gradient fills when price action pushes outside ±1; optional background shading for quick scanning.
Trend Radar : Thin stripes just outside the band that show up‑ or down‑bias using a fast‑vs‑slow EMA spread with anti‑flicker logic.
Participation : Shading that reflects who’s pushing — by MFI, classic up/down volume, delta volume, or a combo model that rewards agreement.
Velocity Pulse : Tiny symbols that only appear when volatility is elevated (outside a neutral 40–60 zone).
Fractal Map : Subtle dashed dividers at Daily / Weekly / Monthly / Yearly / 5‑Year boundaries (Auto picks a sensible cadence).
Divergences : Regular bullish/bearish tags at pivots, with an optional high‑probability filter.
Unified Signals : One common vertical level for triangles (OS/OB re‑entries) and divergence icons so your eye doesn’t hunt.
Profiles : Four presets tune all lookbacks together so the tool stays consistent across timeframes.
Themes : Multiple palettes or fully custom bear/mid/bull colors.
Alerts : Ready for “Any alert() function call” with OS/OB and Divergence options.
⚙️ Settings
Every adjustable input in plain English. Set your profile, show or hide reference levels, pick a theme, and toggle components so the visuals match your style and timeframe.
Trading Profile : Scalping / Day Trade / Swing / Investment — automatically adjusts core lengths.
−1…+1 Levels : Show reference lines at ±1.
Smoothing & Length : EMA smoothing for The Line.
OS/OB Zones & Show Fill : Optional background shade plus gentle gradient fills beyond ±1.
Theme : Presets (Default, Blue–Orange, Green–Red, Teal–Fuchsia, Aqua–Purple, Black–Green, Black–White) or Custom .
Divergences : Turn on detection at pivot highs/lows. Length sets left/right bars. HP filter asks that at least one oscillator anchor sits outside ±1.
Participation : Choose MFI , Volume , Delta Volume , or MFI + Vol + Delta . Set the window; optionally smooth it.
Trend Radar : Up or down stripes just beyond ±1 based on a fast/slow EMA spread. Tune Fast and Slow .
Velocity Pulse : Symbols appear only when volatility exits the 40–60 zone; use Fast / Slow to adjust sensitivity.
Fractal Map : Vertical dividers at time boundaries. Auto selects per timeframe, or pick Daily / Weekly / Monthly / Yearly / 5 Years .
Signals : Show All , only OS/OB , or only Divergence markers (shared height for quick scanning).
Alerts - OS/OB Conditions : Fire when The Line enters extremes (crosses above +1 or below −1).
Alerts - OS/OB Signals : Fire when The Line re‑enters the band (comes back inside from > +1 or < −1).
Alerts - Divergence Conditions : Raw regular divergences right when the pivot forms (no HP filter).
Alerts - Divergence Signals : Confirmed regular divergences that pass the HP filter.
⚡️ Showcase
A visual gallery of the indicator's components. Each image highlights one layer at a time—The Line, OS/OB fills, Trend Radar, Participation, Velocity Pulse, Fractal Map, Divergences, and Signals—so you can quickly recognize how each looks on a live chart.
The Line
Participation
Trend Radar
Velocity Pulse
Fractal Map
Divergences
Signals
Overbought/Oversold
📒 Usage
Hands‑on guidance for reading the line, thresholds, and add‑ons in live markets. Learn when to favor continuation vs. mean‑reversion, how to weigh participation and volatility, and where to set invalidation and targets.
Scale : 0 = balance. ±1 = adaptive extremes. A push beyond ±1 isn’t an automatic fade — check trend stripes, participation, and volatility.
Trend vs Mean‑Revert : With bull stripes, favor pullback buys on OS re‑entries; with bear stripes, favor fades on OB re‑entries.
Participation : Strong positive shading supports continuation; weak/negative during new highs is a caution flag.
Volatility Pulse : Symbols only appear when energy is high. In trends they often mark expansion; counter‑trend they can precede snap‑backs.
Divergences : Raw is early; HP is selective. Treat HP as higher‑quality context, not a stand‑alone signal.
Risk : Use nearby structure (swing points, session highs/lows, or a fractal divider) for invalidation. Scale targets around 0 / ±1 and current vol.
Profiles : If entries feel late/early, try a different profile before hand‑tuning every length.
🚨 Alerts
What you can be notified about and how to turn it on. Covers entering extremes, re‑entries from extremes, and divergence detections, with a recommended schedule (once per bar close).
OS/OB Condition — Entered Overbought → when The Line moves up through +1.
OS/OB Condition — Entered Oversold → when The Line moves down through −1.
OS/OB Signal — Re‑Entry from Overbought/Oversold → when The Line comes back inside from an extreme.
Divergence Condition — Bullish/Bearish (raw) → printed as soon as a regular divergence is detected.
Divergence Signal — Bullish/Bearish (confirmed) → only fires when the high‑probability filter passes.
⚠️ Disclaimer
These tools are exclusively available on the TradingView platform.
Our charting tools are intended solely for informational and educational purposes and should not be regarded as financial, investment, or trading advice. They are not designed to predict market movements or offer specific recommendations. Users should be aware that past performance is not indicative of future results and should not rely on these tools for financial decisions. By using these charting tools, the purchaser agrees that the seller and creator hold no responsibility for any decisions made based on information provided by the tools. The purchaser assumes full responsibility and liability for any actions taken and their consequences, including potential financial losses or investment outcomes that may result from the use of these products.
By purchasing, the customer acknowledges and accepts that neither the seller nor the creator is liable for any undesired outcomes stemming from the development, sale, or use of these products. Additionally, the purchaser agrees to indemnify the seller from any liability. If invited through the Friends and Family Program, the purchaser understands that any provided discount code applies only to the initial purchase of Candela's subscription. The purchaser is responsible for canceling or requesting cancellation of their subscription if they choose not to continue at the full retail price. In the event the purchaser no longer wishes to use the products, they must unsubscribe from the membership service, if applicable.
We do not offer reimbursements, refunds, or chargebacks. Once these Terms are accepted at the time of purchase, no reimbursements, refunds, or chargebacks will be issued under any circumstances.
By continuing to use these charting tools, the user confirms their understanding and acceptance of these Terms as outlined in this disclaimer.
Recherche dans les scripts pour "session high"

AEON | Liquidity HunterA visual tool for identifying high-probability liquidity zones across multiple timeframes and sessions.
Overview
Liquidity Hunter is a multi-timeframe, all market tool designed to help traders visualise areas where price may be drawn in search of resting liquidity. These liquidity zones often align with swing highs and lows, session extremes, or significant higher-time-frame reference points.
Rather than producing entry or exit signals, this indicator aims to support market behaviour analysis and contextual awareness.
Core Functions
The indicator identifies potential liquidity areas using four optional methods:
1. Current Time Frame Analysis – Automatically locates swing highs and lows based on a customisable setting for sensitivity and lookback depth.
2. Higher Time Frame Analysis – Uses the same logic as above, but projects liquidity zones from a selected higher time frame (HTF).
3. Session Highs & Lows – Highlights the Asian, London, New York, or user-defined session extremes where liquidity commonly pools.
4. Time-Based Highs & Lows – Marks the final bar of any higher time frame (for example, the last H4 or D1 candle) to show potential liquidity reference points.
Each method can be enabled or disabled independently and visually customised, allowing traders to tailor the display to their preferred style and time frame.
How to Use
When applied, the indicator plots horizontal levels representing potential liquidity pools. These levels persist until price engages with or mitigates them, at which point users can opt to modify their visual style or delete them as preferred.
Adjusting the sensitivity of the current and higher time frame levels may reflect the market's likelihood of treating them as targets or reversal points.
Many traders combine these levels with concepts such as market structure shifts, displacement, or fair-value gaps to build a narrative around price behaviour.
Disclaimer
This indicator is provided for educational and informational purposes only. It does not constitute financial advice or a trade signal. Past performance or visual confluence does not guarantee future results.
---
About the Author
Created by a passionate developer focused on algorithmic and quantitative concepts.
DTR & ATR with live zonesThis indicator is designed to help traders gauge the day's volatility in real-time. It compares the current Daily True Range (DTR)—the distance between the session's high and low—to the historical Average True Range (ATR).
The main purpose is to project potential price levels where the market might reach based on its average volatility. These levels (100% ATR, 150%, 200%, etc.) can be used as price targets. For instance, if you're in a long trade, you might consider taking partial or full profits as the price approaches these upper ATR extension levels. The indicator is highly customisable, allowing you to control the appearance of the ATR lines, zones, and labels to fit your charting preferences.
Core Concepts: ATR and DTR
To use this indicator effectively, it's important to understand its two main components:
Average True Range (ATR): This is a classic technical analysis indicator that measures market volatility. It calculates the average range of price movement over a specific period (e.g., 14 days). A higher ATR means the price is, on average, moving more, while a low ATR indicates less volatility. This script uses a higher timeframe ATR (e.g., Daily) to establish a stable volatility baseline for the current trading day.
Daily True Range (DTR): This is simply the difference between the current trading session's highest high and lowest low (session high - session low). It tells you how much the price has actually moved so far today.
The indicator's logic revolves around comparing the live, unfolding DTR to the historical, baseline ATR. An on-screen table conveniently shows this comparison as a percentage, to show how volatile the day has been.
How It Works: The Dynamic & Locked Mechanism
The most clever part of this indicator is how it draws the ATR levels. It operates in two distinct phases during the trading session:
Phase 1: Dynamic Expansion (Before DTR meets ATR)
At the start of the session, the DTR is small. The indicator calculates the remaining range needed to "complete" the 100% ATR level (difference = avg_atr - dtr). It then adds this remaining amount to the session high and subtracts it from the session low. This creates a "floating" 100% ATR range that expands dynamically as the session high or low is extended.
Phase 2: The Lock-in (After DTR meets or exceeds ATR)
Once the day's range (DTR) becomes equal to or greater than the avg_atr, the day has met its "expected" volatility. At this point, the levels lock in place. The indicator intelligently determines the anchor point for the locked range.
Once this primary 100% ATR range is established (either dynamically or locked), the script projects the other levels (150%, 200%, 250%, and 300%) by adding or subtracting multiples of the avg_atr from this base.
How to Use It for Trading
The primary use of this indicator is to set logical, volatility-based price targets.
Setting Profit Targets: If you enter a long position, the upper ATR levels (100%, 150%, 200%) serve as excellent areas to consider taking profits. A move to the 200% or 250% level often signifies an overextended or "exhaustion" move, making it a high-probability exit zone. For short positions, the lower ATR levels serve the same purpose.
Assessing Intraday Momentum: The on-screen table tells you how much of the expected daily range has been used. If it's early in the session and the DTR is only at 30% of the ATR, you can anticipate more significant price movement is likely to come. Conversely, if the DTR is already at 150% of ATR, the bulk of the day's move may already be complete.
Mean Reversion Signals: If the price pushes to an extreme level (e.g., 250% ATR) and shows signs of stalling (e.g., bearish divergence on an oscillator), it could signal a potential reversal or pullback, offering an opportunity for a counter-trend trade.
Key Settings
ATR Length & Smoothing Type: These settings control how the baseline ATR is calculated. The default 14 period and RMA smoothing are standard, but you can adjust them to your preference.
Session Settings: This is crucial. You must set the Market Session and Time Zone to match the primary trading hours of the asset you are analysing (e.g., "0930-1600" for the NYSE session).
Show Lines / Show Labels / Show Zones: The script gives you full control over the visual display. You can toggle each ATR level's lines, labels, and background zones individually to avoid a cluttered chart and focus only on the levels that matter to your strategy.

ICT Essentials [LDT]ICT Essentials
Overview
ICT Essentials is an all-in-one trading utility built to create a natural and efficient workflow for ICT-based traders.
Every component has been designed to integrate seamlessly and update dynamically across timeframes.
The indicator focuses on clarity, performance and customization, allowing traders to tailor every part of their trading experience.
Equal Highs & Lows
This feature automatically detects and marks Equal Highs (EQH) and Equal Lows (EQL) with full control over visuals and behavior.
Users can customize line colors, widths, and styles, label size, color, background transparency and text offset.
The logic uses an optimized scanning and caching system that maintains smooth performance even on higher timeframes.
It provides a precise and adaptive way to identify structural liquidity points whilst keeping the chart clean and readable.
Killzones & Session Pivots
Plots the main trading sessions such as Asia, London and New York (AM, Lunch, PM) with full flexibility and styling options.
Each session can be enabled or disabled individually, with its own color, transparency and label preferences.
Session highs and lows are automatically tracked and plotted as pivots with extension modes like Until Mitigated or Past Mitigation.
This system gives traders the ability to organize market sessions exactly how they prefer whilst keeping the chart consistent and efficient.
Daily Pivots and Tier System
Alongside session pivots, the script tracks daily highs and lows to provide a broader structural view of price. These pivots are stored and displayed on the chart with their appearance updating automatically when price interacts with them.
The system includes a unique tier-based visibility filter that maintains a clean chart by preventing duplicate or overlapping pivots. Recent daily pivots are cached and compared to session pivots and when two levels fall within a defined proximity, the redundant one is automatically hidden. This creates a clear hierarchy of daily and session levels, keeping the most relevant structure visible whilst removing noise.
All aspects of the daily pivot system are fully customizable, including the number of tracked pivots, color, style settings and how mitigated levels are handled. The caching and filtering logic ensures smooth performance and a visually organized workspace even as the data updates in real time.
Key Times
Allows up to five custom key time markers such as the Midnight Open, 6:00 AM or 10:00 AM.
Each marker can be fully customized with its own text, color, line style and thickness.
This makes it simple to visualize key reaction points that align with each traders timing model.
Higher Timeframe Candles
Displays higher timeframe candles such as 1H, 4H or Daily directly on the active chart to provide context without switching views.
Users can customize body, wick and border colors, along with adding optional trace lines for the open, close, high and low and can also show the countdown timers for remaining candle time.
Adjustable spacing, positioning and label visibility makes the display blend naturally with any trading setup.
This module helps traders connect multiple timeframes visually in a clean and intuitive way.
Watermark
Adds a customizable watermark with title, subtitle and symbol or timeframe information.
Every element can be adjusted for color, size, transparency, alignment and position.
The result is a polished, professional chart layout that adapts to the user's personal style.
Optimization and Design
ICT Essentials is built for performance, using cached arrays and lightweight calculations to maintain responsiveness on all timeframes.
Each feature can be toggled individually to suit the traders focus or system performance.
The script delivers a fluid, customizable and highly optimized trading experience designed to feel natural and effortless in day-to-day use.
Credits
This script takes reference and inspiration from several open-source indicators:
Equal Highs and Lows by jzstur
ICT HTF Candles (fadi) by fadizeidan
ICT Killzones + Pivots EP by tradeforopp
AG FX - Watermark by AGFXTRADING
All components have been refactored, optimized and unified into a single framework for a smoother and more efficient workflow.

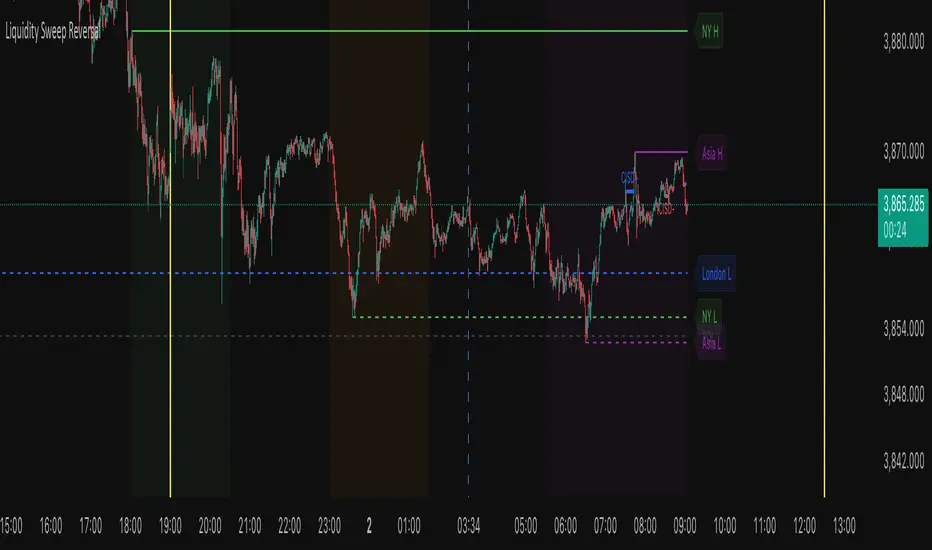
Liquidity Sweep ReversalThe Liquidity Sweep Reversal indicator is a sophisticated price-action-based tool designed for TradingView that identifies high-probability reversal setups by combining institutional liquidity concepts with session-based market structure. It detects potential reversals after price "sweeps" key support/resistance levels—such as prior day/week highs and lows or session extremes (Asian, London, New York)—followed by a rejection pattern.
The core logic revolves around two main signal types:
CISD (Close Inside, Sweep, Divergence) patterns that confirm liquidity grabs on higher timeframes.
Engulfing candlestick reversals occurring shortly after a touch of a key level within a defined lookback window.
To enhance relevance and reduce noise, the indicator optionally restricts signals to high-volatility “Killzone” sessions—including Asian, London, and New York AM/PM overlap periods—where institutional activity is typically concentrated.
Users can fully customize:
Timezone and higher timeframe (HTF) settings
Which key levels to monitor (PDH, PDL, PWH, PWL, session highs/lows)
Visual styling (line types, colors, labels)
Signal sensitivity (max bars after touch, signal size)
Display options (background highlights, level visibility, historical signal filtering)
Additionally, the script draws vertical lines for today’s and tomorrow’s London (08:00 CET) and New York (09:30 EST) market opens to provide contextual reference.
This tool is ideal for traders using auction market theory, order flow, or institutional footprint strategies who seek confluence between liquidity pools, session structure, and price rejection.
Elite Zone Master Pro - Advanced Multi-Session Trading System🚀 Elite Zone Master Pro - Advanced Multi-Session Trading System
🎯 ORIGINALITY & UNIQUE VALUE PROPOSITION
Elite Zone Master Pro is NOT a simple mashup of existing indicators. It's a proprietary trading system that combines three distinct methodologies into a unified, synergistic approach:
Multi-Session Zone Analysis - Original algorithm for tracking global market sessions
Dynamic Opening Range Breakout (ORB) - Enhanced ORB with bias-aware signal filtering
Advanced Fair Value Gap Detection - Proprietary FVG identification with smart mitigation tracking
🔧 Why This Combination Works
The power lies in how these components work together, not separately:
Session zones provide market context and volatility windows
ORB system identifies key breakout levels during optimal timeframes
FVG detection pinpoints precise entry locations within the ORB framework
Integrated bias system filters signals based on range direction momentum
🧠 DETAILED METHODOLOGY & CALCULATIONS
🌍 1. Multi-Session Zone Framework
What it does: Tracks and visualizes three major global trading sessions simultaneously.
How it works:
Dynamic zone tracking algorithm that calculates session highs/lows in real-time
Adaptive box rendering that expands/contracts based on actual price movement
Session overlap detection for identifying high-volatility periods
Time-weighted zone positioning using custom timezone calculations
Original concepts:
Simultaneous multi-session visualization (not found in standard session indicators)
Dynamic zone expansion based on volatility, not fixed time periods
Cross-session momentum analysis for bias determination
🎯 2. Enhanced Opening Range Breakout System
What it does: Identifies breakout opportunities from predefined session ranges with intelligent bias filtering.
How it works:
Multi-session ORB calculation: Supports US (16:30-16:45), EU (10:00-10:15), Asian (03:00-03:15), and custom sessions
Dynamic range establishment: Range is built in real-time during active session periods
Bias-aware signal filtering: Two-tier breakout system based on range midpoint momentum
Range direction analysis: Compares current range midpoint to previous session's midpoint
Original methodology:
Range Bias Calculation:
- If Current_Midpoint > Previous_Midpoint = Bullish Bias (+1)
- If Current_Midpoint < Previous_Midpoint = Bearish Bias (-1)
- If Current_Midpoint = Previous_Midpoint = Neutral Bias (0)
Signal Logic:
- Bullish Bias: Standard breakout above range high
- Bearish Bias: Enhanced breakout (range_high + 0.5 * range_width) for bullish signals
- Neutral Bias: Standard breakouts both directions
⚡ 3. Advanced Fair Value Gap (FVG) Detection
What it does: Identifies and tracks fair value gaps with automatic mitigation detection.
How it works:
Three-bar gap analysis: Compares current bar relationships to identify true gaps
Dynamic threshold calculation: Auto-adjusting sensitivity based on market volatility
Smart mitigation tracking: Automatically removes filled gaps from display
Directional bias integration: Color-codes gaps based on their directional implication
Proprietary algorithms:
Bullish FVG Criteria:
- Current_Low > High (gap condition)
- Close > High (confirmation)
- (Current_Low - High ) / High > Threshold (significance filter)
Bearish FVG Criteria:
- Current_High < Low (gap condition)
- Close < Low (confirmation)
- (Low - Current_High) / Current_High > Threshold (significance filter)
Mitigation Logic:
- Bullish FVG: Mitigated when Close < FVG_Low
- Bearish FVG: Mitigated when Close > FVG_High
📈 4. Session-Based Moving Average System
What it does: Calculates moving averages that reset and adapt to session boundaries.
How it works:
Session-aware length calculation: Effective length = min(bars_since_session_start, user_length)
Multiple MA types: EMA, SMA, RMA, WMA, VWMA with session-specific calculations
Dynamic smoothing: Adapts to session length for consistent signals across different session durations
🔄 INTEGRATED SYSTEM SYNERGY
🎯 How Components Work Together
Context Layer: Session zones provide market timing context
Setup Layer: ORB system identifies breakout opportunities within optimal timeframes
Entry Layer: FVG detection pinpoints precise entry levels
Filter Layer: Bias system ensures alignment with momentum direction
Confirmation Layer: Session MA provides trend confirmation
🧭 Signal Generation Process
Step 1: Session Analysis
- Identify active trading session
- Calculate session volatility metrics
- Establish range boundaries
Step 2: Range Bias Calculation
- Compare current vs previous range midpoints
- Assign directional bias (-1, 0, +1)
- Adjust breakout thresholds accordingly
Step 3: Breakout Detection
- Monitor price interaction with range boundaries
- Apply bias-specific breakout criteria
- Generate preliminary signals
Step 4: FVG Confirmation
- Scan for fair value gaps within range
- Validate gap significance using dynamic thresholds
- Provide entry refinement opportunities
Step 5: Signal Validation
- Cross-reference with session MA direction
- Ensure alignment with overall bias
- Output final trading signals
📊 PRACTICAL IMPLEMENTATION
🎯 Trading Strategy Framework
Setup Phase:
Configure session times for your timezone
Enable preferred sessions (US/EU/Asian)
Adjust FVG sensitivity based on instrument volatility
Execution Phase:
Wait for range establishment during active session
Monitor for bias-aligned breakouts
Look for FVG retest opportunities
Enter trades with ORB-based stop losses
Risk Management:
Stop loss placement: Outside ORB range boundaries
Position sizing: Based on range width volatility
Trade direction: Must align with calculated range bias
🎨 UNIQUE VISUAL IMPLEMENTATION
📊 Advanced Visualization Features
Multi-layered zone rendering with transparency controls
Dynamic range boxes that adapt to price movement
Smart label positioning to avoid chart clutter
Color-coded bias indication through range fills
Progressive FVG display with automatic cleanup
🔧 TECHNICAL SPECIFICATIONS
⚙️ Performance Optimizations
Efficient array management for FVG tracking
Memory optimization through historical data cleanup
Smart rendering to prevent chart overload
Error handling for edge cases and invalid timeframes
📈 Compatibility
All timeframes under 1 day
All instruments (Forex, Stocks, Crypto, Futures)
All chart types with overlay capability
Mobile and desktop platform support
🏆 WHAT MAKES THIS DIFFERENT FROM OTHER INDICATORS
❌ Standard ORB indicators: Only show basic range breakouts without bias consideration
❌ Basic FVG indicators: Don't integrate with session analysis or range systems
❌ Session indicators: Simply highlight time periods without actionable trading signals
❌ Moving average indicators: Don't adapt to session dynamics
✅ Elite Zone Master Pro: Combines all elements with proprietary logic for a complete trading system
📋 USE CASES & MARKET APPLICATION
🎯 Primary Applications
Forex day trading during major session overlaps
Index futures scalping using session-specific ranges
Cryptocurrency swing trading with 24/7 session analysis
Stock market opening range breakout strategies
📊 Performance Characteristics
Best performance: During high-volatility session transitions
Optimal timeframes: 1m to 4H for intraday trading
Risk-reward ratios: Typically 1:2 to 1:4 based on range width
Win rate: Higher probability when all components align
This indicator represents months of development combining institutional trading concepts with retail accessibility. It's not just another indicator - it's a complete trading methodology in one comprehensive tool.
BDNS ORB Strategy v3BDNS Opening Range Breakout Strategy
What This Strategy Does This strategy implements an Opening Range Breakout (ORB) system that identifies the high and low prices during a customizable opening period, then trades breakouts above or below these levels with momentum confirmation. The strategy goes beyond basic ORB concepts by incorporating ADX momentum filtering, VWAP directional bias, dynamic position sizing, and sophisticated exit management including breakeven moves and trailing stops.
Core Strategy Logic
Opening Range Definition: The strategy tracks price action during a user-defined opening period (default: 9:30-9:35 AM ET for 5 minutes). During this time, blue horizontal lines appear marking the session high and low. A yellow background highlights this opening range period.
Breakout Detection: After the opening range completes, green and red horizontal lines appear showing the actual entry levels - these are offset from the range boundaries by a configurable number of ticks (default: 24 ticks) to filter out false breakouts and ensure committed moves.
Entry Conditions: Trades trigger when price breaks through these offset levels during the trading window (green background, default until 10:30 AM ET), but only when:
ADX momentum indicator exceeds threshold (default 24.0) in the breakout direction
Price relationship to VWAP confirms directional bias (when VWAP filter enabled)
Daily trade limits haven't been reached
Large range filtering conditions are met
Visual Elements and Usage
Range Lines: Blue lines show the actual opening range boundaries. These appear immediately when the opening session begins.
Entry Levels: Green (long) and red (short) lines show where trades will trigger, appearing after the opening range completes.
Information Table: A data table appears in the top-right showing real-time strategy status including range size in ticks, ADX readings, filter status, trade counts, and momentum conditions.
Position Management:
When in a trade, colored circles appear showing:
Lime circles: Long position targets (T1, T2, T3)
Orange circles: Short position targets
Red circles: Stop loss levels
Blue crosses: Breakeven levels (when that feature activates)
Purple lines: Trailing stop levels (when position 3 trailing activates)
Background Colors:
Yellow: Opening range session active
Green: Trading window active
Purple: Large range day detected
Gray: Large range day being skipped
Position Management System
The strategy uses a three-tier exit approach:
Position 1: Takes partial profits at first target (default 50% of range size)
Position 2: Exits at second target (default 100% of range size)
Position 3: Either exits at third target or uses trailing stop after Position 2 wins
Breakeven Feature: When enabled and price reaches the breakeven trigger level, all stop losses move to a more favorable breakeven level instead of the original stop, protecting against giving back profits.
Trailing Stop System: After Position 2 hits its target, Position 3 automatically switches to a trailing stop that moves in the trader's favor as price continues trending.
Customization for Different Instruments
The default settings are configured for MNQ (Micro NASDAQ futures) but the ORB concept is highly customizable for any futures instrument and timeframe. Range duration, breakout offsets, and filter thresholds should be adjusted based on the specific instrument's volatility characteristics and typical intraday patterns.
Filter Usage Guidelines
ADX Momentum Filter: Essential for avoiding breakouts during consolidation. Higher thresholds (30+) for trending markets, lower (20-25) for more opportunities.
VWAP Filter: Helpful in trending conditions but may reduce trade frequency. Better to disable during range-bound or mean-reverting periods.
Large Range Filter: Critical risk management tool. When the opening range exceeds your threshold:
Skip: Avoids trades when stops would be too large
Fade: Trades mean reversion back into the range
Trade: Takes breakouts regardless (higher risk)
Range Size Considerations: Setting a large range threshold (200-400 ticks) helps avoid days when both sides of the range get tested before any meaningful breakout occurs, which often leads to whipsaws.
Risk Management Features
Dynamic Stops and Targets: All exit levels scale with the opening range size, ensuring risk/reward remains consistent regardless of daily volatility. A 100-tick range day will have proportionally smaller stops than a 300-tick range day.
Position Sizing: Configure contract amounts for each position tier based on account size and risk tolerance.
Daily Trade Limits: Prevents overtrading by limiting trades per direction per day.
Breakout Offset: The tick offset from range boundaries is crucial - too small creates false signals, too large misses good moves. Test different values based on your instrument's typical noise levels.
Advanced Features
Large Third Target: Set Target 3 to 300-500% to essentially hold runners indefinitely, using the trailing stop as the primary exit method for capturing extended trends.
Fade Trading: On large range days, the strategy can trade mean reversion when initial breakouts fail, often providing good counter-trend opportunities.
Time-Based Exits: All positions close at the end of the trading window, preventing overnight risk.
Strategy Properties Used
Initial Capital: $5,000 (realistic for micro contract trading)
Commission: $0.50 per contract (realistic retail rates)
Position Size: 100% of equity (manages risk through contract quantities and stop placement)
Default quantities: 3/1/1 contracts across the three positions
The default settings assume larger account sizes or proprietary trading firm accounts where higher risk tolerance is acceptable. With MNQ at $0.50 per tick, a typical 200-tick opening range with 75% stop loss (150 ticks) would risk $375 on a 5-contract position. For smaller retail accounts, consider reducing position sizes significantly - using only Position 1 (3 contracts) would risk $225, or even reducing to 1-2 total contracts to maintain appropriate risk levels relative to account size.
Getting Started Apply the strategy to your preferred instrument
Adjust the opening range time and duration for your market
Set appropriate breakout offset based on typical noise levels
Configure large range threshold based on your risk tolerance
Test filter combinations to find what works best for your trading style
Adjust contract quantities based on your account size and risk management rules
The strategy works best on liquid instruments with clear opening sessions and sufficient volatility to generate meaningful ranges. Results will vary significantly based on market conditions, parameter settings, and the specific instrument traded.
I warrant that the information created and published by by me here on TradingView is not prohibited, doesn't constitute investment advice, and isn't created solely for qualified investors.

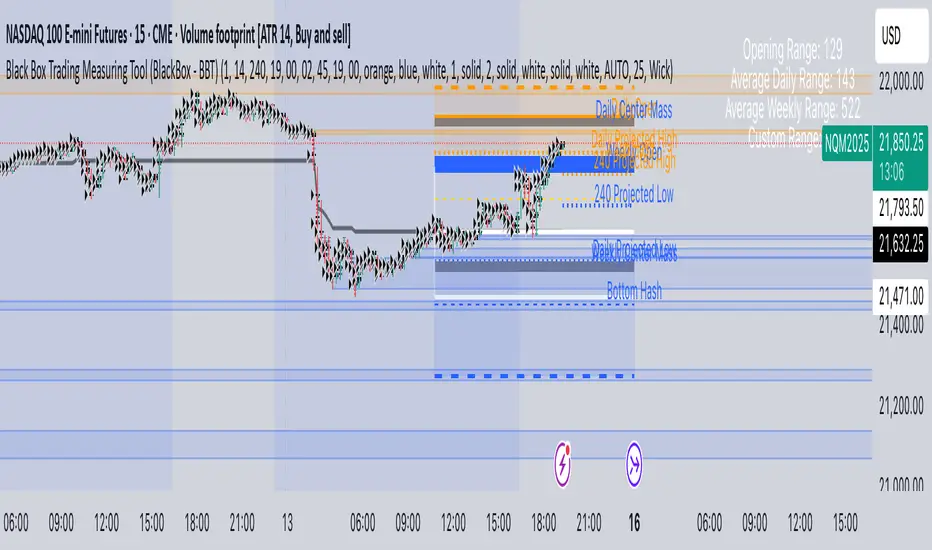
Black Box Trading Measuring Tool (BlackBox - BBT)Overview
The Black Box Trading Indicator is a comprehensive technical analysis tool that combines multiple trading concepts into a single, powerful indicator. It displays custom session ranges, Average Daily Range (ADR) projections, support/resistance levels, and order blocks to help traders identify key market levels and potential trading opportunities.
Key Features
1. Custom Session Ranges
Define and visualize any trading session with customizable start and end times
Automatically calculates session high, low, and midpoint
Displays quarter levels (25% and 75% of range)
Shows range projections at 100%, 150%, 200%, and 250% extensions
2. Average Daily Range (ADR) Analysis
Calculates and displays ADR for daily, weekly, monthly, and custom timeframes
Shows projected high and low targets based on ADR
Includes "hash" levels at 50% ADR from session midpoint
Visual range boxes highlight potential support/resistance zones
3. Market Structure Levels
Daily and weekly opening prices with dynamic coloring
Previous daily and weekly center mass (50% of previous period's range)
Real-time range statistics displayed in an information table
4. Order Block Detection
Automatically identifies bullish and bearish order blocks
Visual representation with customizable colors and transparency
Mitigation tracking to remove invalidated blocks
Alert system for price interaction with order blocks
Parameter Guide
Display Settings
Show Blocks
Enables/disables order block visualization
Useful for cleaner charts when focusing on other elements
Show Previous Daily/Weekly Center Mass
Displays the midpoint of the previous period's range
Helps identify potential support/resistance from prior price acceptance areas
Show Daily/Weekly Open
Shows opening prices with color coding (blue for bullish, orange for bearish)
Important reference points for intraday trading
Show ADR Targets
Displays projected highs and lows based on Average Daily Range
Essential for setting realistic profit targets and stop losses
Show Range Projection
Extends the session range by multiples (1x, 1.5x, 2x, 2.5x)
Helps identify potential price targets during trending moves
Show Average Daily Range
Displays the ADR statistics table
Shows current range metrics for multiple timeframes
Display range in pips
Converts range values to pips for forex traders
Provides standardized measurement across different instruments
ADR Configuration
ADR Days
Number of days to include in current ADR calculation
Default: 1 (shows today's developing range)
ADR Period
Lookback period for calculating average range
Default: 14 days (standard period for volatility measurement)
Custom Range
Select between 60-minute or 240-minute timeframes
Allows analysis of intermediate timeframes
Session Time Settings (EST)
Start Hour/Minute
Define when your custom session begins
Default: 19:00 EST (Asian session open)
End Hour/Minute
Define when your custom session ends
Default: 02:45 EST (London session approach)
Extend To Hour/Minute
How far to extend the horizontal lines
Default: 19:00 EST (full 24-hour extension)
Visual Customization
Color Settings
Top Color: Used for upper levels and bullish projections
Bottom Color: Used for lower levels and bearish projections
Range Outline Color: Main session range boundaries
Center Range Line Color: Session midpoint visualization
Line Settings
Range Outline Width: Thickness of range box borders
Session Line Width: Thickness of horizontal level lines
Line Styles: Choose between solid, dashed, or dotted
Text Settings
Text Color: Color for all labels
Text Size: AUTO, tiny, small, normal, or large
Order Block Settings
Sensitivity
Percentage threshold for order block detection (1-100)
Higher values = fewer but stronger blocks
Default: 25 (detects 25% price movements)
OB Mitigation Type
Close: Block is mitigated when price closes beyond it
Wick: Block is mitigated when price wicks beyond it
Color Configuration
Separate colors for bullish and bearish blocks
Border and background colors can be customized independently
Trading Applications
1. Session-Based Trading
Identify the initial balance (first hour of trading)
Trade breakouts from defined session ranges
Use range projections for profit targets
Monitor for range-bound vs trending conditions
2. ADR-Based Strategies
Set daily profit targets based on ADR projections
Identify overextended moves when price exceeds ADR
Use ADR levels for position sizing and risk management
Compare current range to average for volatility assessment
3. Support/Resistance Trading
Use previous period center mass as dynamic S/R
Trade bounces from daily/weekly opens
Combine multiple timeframe levels for confluence
Monitor order blocks for potential reversal zones
4. Order Block Trading
Enter trades when price returns to unmitigated blocks
Use blocks as stop loss placement guides
Look for confluence with other indicator levels
Monitor block mitigation for trend confirmation
Best Practices
1. Multi-Timeframe Analysis
Use higher timeframe blocks for major levels
Combine with lower timeframe entries
Monitor weekly levels on daily charts
2. Confluence Trading
Look for areas where multiple levels align
Combine order blocks with ADR targets
Use session ranges with center mass levels
3. Risk Management
Use ADR for realistic daily profit targets
Place stops beyond order blocks or range extremes
Size positions based on distance to key levels
4. Alert Usage
Set alerts for ADR target hits
Monitor order block interactions
Track range breakouts and hash level tests
Tips for Effective Use
Start Simple: Begin with basic session ranges and ADR before adding all features
Color Coding: Use consistent colors across your trading setup
Time Zones: Ensure session times match your trading schedule
Clean Charts: Toggle off unused features for clarity
Backtesting: Study how price respects these levels historically
Journaling: Document which levels work best for your traded instruments
Common Trading Scenarios
Range Trading
Enter longs at session low or lower projections
Enter shorts at session high or upper projections
Target the session midpoint or opposite extreme
Breakout Trading
Wait for clear breaks of session range
Use range width for measuring targets
Monitor ADR to gauge breakout potential
Trend Following
Use order blocks as pullback entries
Trail stops using range projections
Scale out at ADR targets
Reversal Trading
Look for price rejection at ADR extremes
Monitor order block mitigation failures
Use center mass as reversal confirmation
AP Session Liquidity with EQH/EQL and Previous DayThis indicator plots key intraday session highs and lows, along with essential market structure levels, to help traders identify areas of interest, potential liquidity zones, and high-probability trade setups. It includes the Asia Session High and Low (typically 00:00–08:00 UTC), London Session High and Low (08:00–12:00 UTC), New York AM Session High and Low (12:00–15:00 UTC), and New York Lunch High and Low (15:00–17:00 UTC). Additionally, it displays the Previous Day’s High and Low for context on recent price action, as well as automatically detected Equal Highs and Lows based on configurable proximity settings to highlight potential liquidity pools or engineered price levels. These session levels are widely used by institutional traders and are critical for analyzing market behavior during time-based volatility windows. Traders can use this indicator to anticipate breakouts, fakeouts, and reversals around session boundaries—such as liquidity grabs at Asia highs/lows before the London or New York sessions—or to identify key consolidation and expansion zones. Equal Highs and Lows serve as magnets for price, offering insight into potential stop hunts or inducement zones. This tool is ideal for day traders, scalpers, and smart money concept practitioners, and includes full customization for session timings, color schemes, line styles, and alert conditions. Whether you're trading price action, ICT concepts, or supply and demand, this indicator provides a powerful framework for intraday analysis.

BD Markup V5BD Markup V5 — Multi-Time-Frame Extremes & Session Shading
Pine Script v6 • overlay = true
What the indicator does
BD Markup V5 automatically plots horizontal extreme levels (highs & lows) taken from completed candles on seven standard time-frames:
1 Year (Y) – Purple – “Show Yearly”
1 Month (M) – Red – “Show Monthly”
1 Week (W) – Orange – “Show Weekly”
1 Day (D) – Green – “Show Daily”
4 Hour (4H) – Black – “Show 4H”
1 Hour (H1) – Yellow – “Show H1”
15 Minutes (M15) – Maroon – “Show M15”
For every candle that closes the script:
Stores that candle’s high & low.
When a new candle of the same aggregation begins, draws two horizontal lines at those stored prices.
Extends each line to the right until price touches it ; at first touch the extension stops.
To keep the chart tidy you can set a Candle Count per time-frame so only the most-recent n highs & lows remain.
A Base Time-Frame filter hides all lower-TF lines (e.g. choosing “H4” hides H1 & M15).
The indicator also includes three custom intraday sessions whose backgrounds can be shaded with user-defined colours & transparency.
Key inputs
Base Time-Frame – show only levels whose aggregation order is equal or larger.
Show TF? check-boxes – enable/disable individual layers.
Colour pickers & Candle Count – customise appearance & history depth for each layer.
Chart Timezone – accepts any IANA name or UTC/GMT offset.
Session 1-3 – toggle, set session string (HHMM-HHMM), colour, and opacity.
How overlapping levels are handled
When a new line would be created at exactly the same price as an existing one:
If the new level comes from a higher time-frame, lower-TF duplicates are removed.
If it comes from a lower time-frame, the script skips drawing to preserve the higher-TF level.
This hierarchy keeps the chart clean and emphasises the most significant structure.
Practical uses
Highlight macro structure (yearly / monthly / weekly extremes).
Mark intraday reference points (previous session highs & lows).
Combine with your own strategies for bias, targets, or liquidity zones.
Visually compare price behaviour inside custom trading sessions.
Limitations & notes
Levels are based on completed candles only; they never repaint but always lag one full period.
Once price touches a level its extension stops, but the line remains until pruned by your Candle Count setting.
The script caps total line objects at 500 to stay within Pine runtime limits.
Disclaimer
This script is published for informational and educational purposes only.
It does not constitute financial advice and is not a solicitation to buy or sell any asset.
Trading and investing involve substantial risk; always perform your own research and consult a licensed professional before acting on any idea.
Past performance or historical levels do not guarantee future results.
By using this indicator you agree that the author is not liable for any loss or damage arising from its use.

[TTM] ICT Sessions & Ranges🌟 Overview 🌟
The ICT Sessions & Ranges Indicator helps traders identify key intraday price levels by marking custom session highs/lows and opening ranges.
It helps traders spot potential liquidity grabs, reversals, and breakout zones by tracking price behavior around these key areas
🌟 Session Highs & Lows – Liquidity Zones 🌟
Session highs and lows often attract price due to stop orders resting above or below them. These levels are frequently targeted during high-volatility moves.
🔹 Asia Session
- Usually ranges in low volatility.
- Highs/lows often get swept during early London.
- Price may raid these levels, then reverse.
🔹 London Session
- First major volatility of the day.
- Highs/lows often tested or swept in New York.
- Commonly forms the day’s true high or low.
🌟 Opening Range Concepts 🌟
The Opening Range is the first 15, 30, or 60 minutes of a session (e.g., New York).
The high (ORH) and low (ORL) define the market’s initial balance and key reaction levels.
🔹 Breakout Trade
- Price breaks ORH/ORL with momentum.
- Signals directional intent.
- Traders enter on the breakout, with stops inside the range.
🔹 Liquidity Raid
- Price briefly breaks ORH/ORL to trigger stops.
- Reverses after the sweep.
- Look for structure shift and entry near FVG or OB.
🌟 Customizable Settings 🌟
The indicator includes 3 configurable ranges , each with:
Start & End Time – Set any custom time window.
Display Type – Choose Box (highlight range) or Lines (mark high/low).
Color Settings – Set custom colors for boxes and lines.
🌟 Default Settings 🌟
Range 1 : 19:00–00:00 (Asia Session)
Range 2 : 01:45–05:15 (London Session)
Range 3 : 09:30–10:00 (NY Opening Range – 30m)

Session Breakouts & Trend Indicator# Session Breakouts & Trend Indicator
This indicator identifies high-probability trading opportunities by tracking key intraday sessions and their breakouts while aligning them with the overall market trend direction.
## What Makes This Indicator Unique
Unlike standard breakout indicators that only identify when price crosses a threshold, this indicator:
- Dynamically identifies and tracks important daily sessions (default: AM 09:00-10:00 and PM 15:00-16:00)
- Determines trend direction using a triple EMA system (20/50/200)
- Shows when breakouts align with the overall trend (higher probability setups)
- Provides visual confirmation with session ranges, breakout levels, and background highlighting
- Includes a comprehensive information panel showing trend/session alignment
## How It Works
The indicator tracks two important daily sessions:
1. **AM Session**: Typically the first hour of trading (default: 09:00-10:00)
2. **PM Session**: Typically the last hour of trading (default: 15:00-16:00)
For each session, it:
- Marks the high and low range
- Establishes breakout levels above/below these ranges
- Detects when price breaks beyond these levels
- Determines if the breakout aligns with the prevailing trend
The trend is calculated using three EMAs (20, 50, 200) for reliable trend identification.
## How To Use
1. Apply the indicator to your chart (works best on 5-minute timeframes)
2. Adjust session times to match your trading schedule if needed
3. Watch for breakouts above session highs (bullish) or below session lows (bearish)
4. Check the information panel to see if the breakout aligns with the trend
5. Enter trades in the direction of trend-aligned breakouts for higher probability setups
6. Set stop losses below the opposite side of the session range
## Settings
- **Session Times**: Customize AM and PM session times
- **EMA Lengths**: Adjust trend determination sensitivity
- **Visualization Options**: Toggle display of sessions, breakouts, and VWAP
- **Alert Settings**: Configure alerts for breakouts and trend-aligned conditions
This indicator is valuable for day traders and swing traders looking for objective entry points with higher probability of success.

VWAP 2.0 with desv + Initial Balance by RiotWolftrading🌟 Overview
This powerful tool is designed for traders who want to harness the power of the Volume Weighted Average Price (VWAP) alongside session-based ranges to make informed trading decisions. Whether you're a day trader or a swing trader, this indicator provides a clean and effective way to identify support, resistance, and market trends—all in one place! 💡
✨ Key Features
Auto-Anchored VWAP 📊
Automatically calculates the VWAP based on a user-defined anchor period (e.g., Daily, Weekly, Monthly).
Resets at the start of each period (e.g., daily for a Daily anchor).
Displays a customizable VWAP line with standard deviation bands to highlight key price levels.
Standard Deviation Bands 📏
Plots up to three sets of standard deviation bands above and below the VWAP (multipliers: 1.0, 2.0, 3.0).
Includes volume percentage labels to show where trading volume is concentrated. 📉
Session High/Low Range 🕒
Identifies the high and low prices within a customizable session (default: 12:00 to 15:31).
Draws horizontal lines at the session high and low, with dotted deviation lines for additional reference points.
Perfect for spotting key levels during your trading session! 🔑
Time-Based Range Box ⏰
Highlights a specific time window (default: 15:40 to 15:50) with a colored box showing the high and low prices.
Ideal for tracking price action during high-impact events like news releases or market opens. 📅
Alerts 🚨
Set up alerts for when the price crosses above or below the VWAP—never miss a potential trading opportunity!
⚙️ Settings
Customize the indicator to fit your trading style with these easy-to-use settings:
VWAP Settings
Timezone 🌍: Select your timezone (default: GMT+2) to align calculations with your local time.
VWAP Source 📈: Choose the price source for VWAP (default: hlc3 - average of high, low, close).
Std Deviation Multipliers 📐: Adjust the multipliers for the bands (default: 1.0, 2.0, 3.0).
Line Width ✏️: Set the thickness of the VWAP and band lines (default: 1).
Session Time ⏳: Define the session window for VWAP calculations (default: 08:00-18:00, all days).
Show Upper/Lower Bands 👀: Toggle visibility for each set of bands (default: Band 1 visible, Bands 2 & 3 hidden).
Range Settings
Range Start/End Time 🕙: Set the time window for the range box (default: 15:40 to 15:50).
Box Color 🎨: Customize the border color (default: blue).
Box Background Color 🖌️: Adjust the background color (default: light aqua, 90% transparency).
I created this indicator to provide a streamlined, clutter-free tool for traders who rely on VWAP and session-based analysis. It focuses on the essentials—VWAP, standard deviation bands, session high/low, and range box—without unnecessary overlays. I hope it helps you in your trading journey! If you have feedback or suggestions, feel free to share—I’d love to hear from you! 😊

Intraday Macro & Flow Indicator# IntraMacroFlow Indicator
## Introduction
IntraMacroFlow is a volume and delta-based indicator that identifies significant price movements within trading sessions. It generates signals when volume spikes coincide with quality price movement, filtered by RSI to avoid overbought/oversold conditions.
> **Note:** This indicator provides multiple signals and should be combined with additional analysis methods such as support/resistance, trend direction, and price action patterns.
## Inputs
### Volume Settings
* **Volume Lookback Period** (14) - Number of bars for volume moving average calculation
* **Volume Threshold Multiplier** (1.5) - Required volume increase over average to generate signals
* **Delta Threshold** (0.3) - Required close-to-open movement relative to bar range (higher = stronger movement)
### Session Configuration
* **Use Dynamic Session Detection** (true) - Automatically determine session times
* **Highlight Market Open Period** (true) - Highlight first third of trading session
* **Highlight Mid-Session Period** (true) - Highlight middle portion of trading session
* **Detect Signals Throughout Whole Session** (true) - Find signals in entire session
* **Session Time** ("0930-1600") - Trading hours in HHMM-HHMM format
* **Session Type** ("Regular") - Select Regular, Extended, or Custom session
### Manual Session Settings
Used when dynamic detection is disabled:
* **Manual Session Open Hour** (9)
* **Manual Session Open Minute** (30)
* **Manual Session Open Duration** (60)
* **Manual Mid-Session Start Hour** (12)
* **Manual Mid-Session End Hour** (14)
## How It Works
The indicator analyzes each bar using three primary conditions:
1. **Volume Condition**: Current volume > Average volume × Threshold
2. **Delta Condition**: |Close-Open|/Range > Delta threshold
3. **Time Condition**: Bar falls within configured session times
When all conditions are met:
* Bullish signals appear when close > open and RSI < 70
* Bearish signals appear when close < open and RSI > 30
## Display Elements
### Shapes and Colors
* Green triangles below bars - Bullish signals
* Red triangles above bars - Bearish signals
* Blue background - Market open period
* Purple background - Mid-session period
* Bar coloring - Green (bullish), Red (bearish), or unchanged
### Information Panel
A dynamic label shows:
* Current volume relative to average (Vol)
* Delta value for current bar (Delta)
* RSI value (RSI)
* Session status (Active/Closed)
## Calculation Method
```
// Volume Condition
volumeMA = ta.sma(volume, lookbackPeriod)
volumeCondition = volume > volumeMA * volumeThreshold
// Delta Calculation (price movement quality)
priceRange = high - low
delta = math.abs(close - open) / priceRange
deltaCondition = delta > deltaThreshold
// Direction and RSI Filter
bullishBias = close > open and entrySignal and not (rsi > 70)
bearishBias = close < open and entrySignal and not (rsi < 30)
```
## Usage Recommendations
### Suitable Markets
* Equities during regular trading hours
* Futures markets
* Forex during active sessions
* Cryptocurrencies with defined volume patterns
### Recommended Timeframes
* 1-minute to 1-hour (optimal: 5 or 15-minute)
### Parameter Adjustments
* For fewer but stronger signals: increase Volume Threshold (2.0+) and Delta Threshold (0.4-0.6)
* For more signals: decrease Volume Threshold (1.2-1.5) and Delta Threshold (0.2-0.3)
### Usage Tips
* Combine with trend analysis for higher-probability entries
* Focus on signals occurring at session boundaries and mid-session
* Use opposite signals as potential exit points
* Configure alerts to receive notifications when signals occur
## Additional Notes
* RSI parameters are fixed at 14 periods with 70/30 thresholds
* The indicator handles overnight sessions correctly
* Fully compatible with TradingView alerts
* Customizable visual elements
## Release Notes
Initial release: This is a template indicator that should be customized to suit your specific trading strategies and preferences.

Open Range Volatility (High/Low %)Overview
The Open-to-High/Low Movement Indicator helps traders visualize the percentage change between the opening price and the highest & lowest points of each trading session. This indicator is particularly useful for identifying intraday volatility, momentum strength, and potential reversals.
Key Features
✅ Real-Time High/Low Percentage Movement – Calculates and plots the percentage movement from the opening price to both the session high (green line) and session low (red line).
✅ Separate Chart Pane – Keeps your main price chart clean while displaying movements in a separate panel.
✅ Zero Reference Line – Helps distinguish upward and downward movements.
✅ +10% and -10% Threshold Lines – Assists in identifying significant price swings.
✅ Customizable & Lightweight – Efficiently tracks market movements without slowing down your chart.
How to Use
When the green line moves higher, it indicates strong buying pressure after the open.
When the red line moves lower, it shows selling pressure from the open price.
If movements stay within a small range, the market is experiencing low volatility.
Extreme movements beyond ±10% can indicate potential breakout or reversal zones.
Best for:
📈 Day traders tracking intraday momentum
📊 Swing traders spotting volatility trends
⚡ Scalpers identifying quick price movements
💡 Volatility-based strategies
This indicator works across all timeframes and asset classes, including stocks, forex, commodities, and crypto.
🚀 Add this to your chart today and stay ahead of the market!

Morning RangeOverview
The Morning Range Indicator highlights the high and low of the market session from 6 AM to 10AM, providing key levels for potential breakout trades. The box dynamically updates in real-time, extending until 4 PM, and adjusts color based on price action.
This tool is ideal for traders looking to identify breakout opportunities and visualize key intraday price ranges.
How It Works
Session High & Low (6 AM - 10 AM)
The indicator tracks the highest high and lowest low within this time window.
Once 10 AM passes, the high and low are locked in and will not change.
Box Extends Until 4 PM
The session box remains visible throughout the trading day.
It provides a visual reference for potential breakout zones.
Dynamic Box Coloring
Gray (Neutral): Neither high nor low is broken.
Green: Only the high is broken before 4 PM.
Red: Only the low is broken before 4 PM.
Yellow: Both high and low are broken before 4 PM.
Live Updating Box
The box appears as soon as the session begins at 6 AM.
It dynamically updates the high and low until 10 AM.
Alerts for Breakouts
This indicator includes built-in alert conditions, so you can set up TradingView alerts without modifying the script.
Morning Range High Broken → Triggers when price breaks above the morning high.
Morning Range Low Broken → Triggers when price breaks below the morning low.
To set alerts:
Click the Alerts (⏰) icon in TradingView.
Select Condition → "Morning Range High Broken" or "Morning Range Low Broken".
Choose your preferred notification method (popup, email, webhook, etc.).
Click Create to activate the alert.
Who This Is For
✔ Intraday & Scalp Traders – Identify key breakout levels for short-term trades.
✔ Futures & Forex Traders – Works great for markets like NQ, ES, Gold, and FX pairs.
✔ Breakout & Reversal Traders – Use the high/low boundaries as support & resistance levels.
Customization
This indicator automatically updates every day and requires no manual input.
You can change alert settings via TradingView’s built-in alert system.
How to Use This Indicator
Watch for breakouts above/below the morning range as potential trade opportunities.
Combine with volume, momentum indicators, or footprint charts for confirmation.
Use the box color to visually assess whether price action is bullish (green), bearish (red), or ranging (gray).

FT SessionsFT Sessions
Overview
The FT Sessions is a highly customizable and powerful indicator designed for intraday traders who focus on session-based analysis. This script visually highlights global market sessions—Asia, Frankfurt, London, and New York (AM & PM)—on the chart, making it easier to track session ranges and analyze intraday price movements.
Key Features
Customizable Session Times and Colors:
Define your own session times and assign unique colors for better visibility.
Session Range Visualization:
Displays high and low ranges for each session.
Optional transparent range areas with outlines for clarity.
Configurable session range labels for enhanced readability.
Flexible Timezone Settings:
Choose a UTC offset or sync with the exchange's timezone.
User-Friendly Customization:
Compact settings for easier adjustments.
Enable or disable specific sessions to focus on relevant market activity.
How This Script Differs from LuxAlgo
This script draws inspiration from LuxAlgo's session tracking concept but has been developed with significant modifications and unique features:
Built from Scratch in Pine Script v5:
Fully optimized for Pine Script’s latest version, improving performance and functionality.
Expanded Session Range Features:
Five unique sessions (Asia, Frankfurt, London, New York AM, New York PM) with customizable ranges, colors, and labels.
Real-time updating of session ranges for improved intraday analysis.
4H Timeframe Optimization:
Automatically notifies users if applied to an unsupported timeframe, ensuring session accuracy.
Highly Configurable Input Options:
Advanced timezone handling and compact session management settings.
Unique Coding Structure:
Designed to maximize efficiency and minimize resource usage on TradingView.
While LuxAlgo focuses on session concepts, this script brings a fresh, customizable approach specifically tailored for intraday traders seeking precision in tracking session activity.
How It Works
The indicator tracks price movements within each session.
Highlights the high and low range of each session directly on the chart.
Updates session ranges in real-time to reflect evolving market conditions.
Practical Applications
Intraday Trading: Plan trades based on major market session ranges.
Breakout Strategies: Use session high and low levels to identify potential breakouts.
Session-Specific Patterns: Spot consolidations and reversals within session activity.
Important Notes
Optimized for the 4H timeframe. If applied to another timeframe, a notification will appear.
Best used in combination with other tools (e.g., volume or trend indicators) for a complete trading strategy.
Credits
This script draws inspiration from LuxAlgo's open-source session-tracking methodology. However, it introduces substantial improvements and unique features that set it apart. Full credit is given to LuxAlgo for their original open-source concept.
Disclaimer
This script is for informational and educational purposes only. Always test on a demo account before applying to live markets.

Key Prices & LevelsThis indicator is designed to visualize key price levels & areas for NY trading sessions based on the price action from previous day, pre-market activity and key areas from NY session itself. The purpose is to unify all key levels into a single indicator, while allowing a user to control which levels they want to visualize and how.
The indicator identifies the following:
Asia Range High/Lows, along with ability to visualize with a box
London Range High/Lows, along with ability to visualize with a box
Previous Day PM Session High/Lows
Current Day Lunch Session High/Lows, starts appearing after 12pm EST once the lunch session starts
New York Open (8:30am EST) price
9:53 Open (root candle) price
New York Midnight (12:00am EST) price
Previous Day High/Lows
First 1m FVG after NY Session Start (after 9:30am), with the ability to configure minimum FVG size.
Opening Range Gap, showing regular market hours close price (previous day 16:15pm EST close), new session open price (9:30am EST open) and optionally the mid-point between the two
Asia Range 50% along with 2, 2.5, 4 and 4.5 deviations of the Asia range in both directions
Configurability:
Each price level can be turned off
Styles in terms of line type, color
Ability to turn on/off labels for price levels and highlighting of prices on price scale
Ability to control label text for price levels
How is it different:
Identifies novel concepts such as 9:53 open, root candle that can be used as a bounce/resistance area during AM/PM sessions as well as confirmation of direction once closed over/under to indicate price's willingness to continue moving in the same direction.
It also shows 1st 1m FVG after New York Session open, that can be used to determine direction of the price action depending on PA's reaction to that area. While both 9:53 and 1m FVG are 1m based markers, these levels are visualized by the indicator on all timeframes from 15s to 1h.
Additionally the indicator is able to both highlight key prices in the price scale pane as well as combine labels to minimize clutter when multiple levels have the same price.
Lastly for in-session ranges such as Lunch High/Low the indicator updates the range in real-time as opposed to waiting for the lunch session to be over.
Daily Structure Cycles - Session - PDH/PDLDescription:
The Session Windows indicator visualizes predefined trading sessions on the chart, highlighting key price ranges with customizable background colors and labels. Designed to track session-specific high and low levels, this tool provides visual guidance for analyzing market behavior across different trading windows. It includes three customizable sessions—Asian, Window 1, and Window 2—that can be toggled on or off.
How It Works:
Each session is marked with a colored box, representing the high and low range for that session. Border colors and box transparency can be customized, allowing for easy visual differentiation.
The indicator also displays the high and low levels of the previous day, marked as PDH (Previous Day High) and PDL (Previous Day Low). When the current price crosses these levels, the line style changes, signaling potential support or resistance levels.
Labels for each session high and low are positioned based on the user-defined offset and alignment options, providing easy-to-read markers at the end of each session.
Usage: This indicator helps traders observe price behavior within distinct trading sessions and how the current price interacts with previous day’s highs and lows, which may offer insight into support/resistance zones. Traders can use this tool to spot breakout or reversal points as price moves through session highs/lows or crosses the previous day’s levels.
Customization Options:
Session Settings: Choose session times for Asian, Window 1, and Window 2.
Color Settings: Set different colors for session background and border lines.
Label Positioning: Adjust label offset and vertical position for high/low markers.
PDH/PDL Levels: Toggle lines for previous day’s high and low, with color and line style options.
Limitations: This indicator is designed for visualization purposes and is best used alongside other tools for confirmation, as it does not provide standalone buy or sell signals.
Trading Sessions with Global HolidaysDescription:
This versatile Pine Script provides traders with a visual representation of major global trading sessions: London, New York, Sydney, Hong Kong, Tokyo, and Frankfurt. By highlighting these sessions on the chart, users can better identify optimal trading opportunities aligned with market activity.
Key Features:
Customizable Colors: Choose distinct colors for each trading session, with adjustable opacity to suit your visual preferences.
Holiday Awareness: The script takes into account significant holidays from various countries, ensuring that sessions are only highlighted when the markets are open.
Weekend Option: Users have the flexibility to display or hide weekend sessions, helping to tailor the analysis to specific trading strategies.
Session Activation: Easily enable or disable individual trading sessions based on your trading preferences, allowing for a customized experience.
Visual Clarity: With subtle color tones, the script maintains a clean and professional appearance, ensuring that the session highlights are noticeable without being overwhelming.
Perfect for: Day traders, swing traders, and anyone interested in global market dynamics. Whether you are a novice or an experienced trader, this tool enhances your ability to analyze market trends and make informed decisions.
Elevate your trading experience with this intuitive and informative Trading Sessions script!

Session Sweeps [LuxAlgo]The Session Sweeps indicator combines ICT-based features for a complete trading methodology involving market sessions, market structure, and fair value gaps to find optimal entry conditions for trading price action.
Traders frequently tend to place stop/limit orders at the high and low points of major trading sessions such as Asian (Tokyo), European (London), and North American (New York), resulting in the establishment of liquidity pools at those particular levels. The Session Sweeps indicator is crafted to recognize and underscore occurrences of session sweeps or liquidity sweeps during these major trading sessions.
🔶 USAGE
Default settings utilize major forex trading sessions, yet users can select their preferred opening and closing times, rename the sessions, or adjust the colors. It's important to note that the specified times for each session align with the respective local timezones: Asian (Tokyo) UTC+9, European (London) UTC, and North American (New York) UTC-5.
If the price briefly crosses either the highest or lowest point of a market session. These movements, aiming at triggering stop losses, suggest potential shifts in the market direction. Detecting such movements is the fundamental purpose and core functionality of the script.
🔹Market Structure Shifts
A Market Structure Shift refers to a change in market direction, either from an uptrend to a downtrend or vice versa. A part of a common entry model when using session sweeps is waiting for the formation of a CHoCH after a session sweep.
🔹Fair Value Gaps
A Fair Value Gap (FVG) holds particular appeal for price action traders, emerging when there are inefficiencies or imbalances in the market, often a result of uneven buying and selling activity. The underlying concept of FVGs is that the market tends to revisit these inefficiencies before resuming its trajectory in alignment with the initial impulsive move.
After the formation of a CHoCH traders can enter a position when the price enters the area of a Fair Value Gap (FVG).
🔹Setup Examples
This entry setup is commonly used by ICT traders and is shared for informational & educational purposes only.
Long Positions (5-Minute Timeframe):
Wait for the previous session's low to be swept.
Look for a Bullish Choch.
Find a Bullish FVG formed by or before the Choch.
Entry Point: At the FVG.
Take Profit (TP): At the session high or aim for a 1:2 Risk-Reward Ratio.
Stop Loss (SL): At the session low or nearest Swing Low.
Take partial profits at intermediate swings, but don’t shift SL prematurely.
Short Positions (5-Minute Timeframe):
Wait for the previous session's high to be swept.
Look for a Bearish Choch.
Find a FVG formed by or before the Choch.
Entry Point: At the FVG.
Take Profit (TP): At the previous session's low or aim for a 1:2 RR.
Stop Loss (SL): At the session high or nearest Swing High.
Take partial profits at intermediate swings, but don’t shift SL prematurely.
🔶 SETTINGS
🔹Session Sweeps
Buyside Sweep Zones, Color, and Margin: toggles the visibility of bullside sweep zones, customizes the associated color, and sets the margin value defining the range of a bullside sweep zone.
Sellside Sweep Zones, Color, and Margin: toggles the visibility of sell-side sweep zones, customizes the associated color, and sets the margin value defining the range of a sell-side sweep zone.
Sweep Margin Length: specifies the maximum allowed length of a sweep zone invalidation, the length over which the price slightly invalidated the margin range.
Detect Sweeps Once per Session: if enabled will detect only once a sweep zone within a session.
Hide Fake Sweep Zones, and Color: controls the visibility and color of the fake sweep zones.
🔹Sessions
Session (Asia, London, New York AM, and New York PM), Start Time, and End Time: enables or disables the visibility of the named market session range, and customization of the session hours.
Color: color customization option of the named session.
Extend Max/Min: extends the highest and lowest price levels of the named session until the end of the next enabled session. This option is recommended to be enabled when sweep zone detection is activated to observe the relationship between the sweep zone and previous session extreme levels.
Extend Mid: extends the mean price levels of the named session until the end of the next enabled session. The extended line may serve as potential support and resistance levels.
Fill: enables/disables background coloring of the named session.
New York DST | London DST: enabling this option initiates Daylight Saving Time (DST) for New York or London. Note: Daylight Saving Time is not applied to the Asian (Tokyo) session.
Sessions Extreme Lines | Sessions Names: toggles the visibility of the highest and lowest price levels, as well as the names, for all market sessions.
Session Lines Width: sets the width of the lines for all sessions.
Session Fill Transparency: sets the background color transparency of the range for all sessions.
🔹Market Structure Shifts
Market Structure Shifts: toggles the visibility of market structure shifts, also known as change of character (CHoCH).
Detection Length: specifies the detection length.
Market Structure Shifts; Bull & Bear: color customization options.
🔹Fair Value Gaps
Fair Value Gaps: toggles the visibility of the fair value gaps.
Fair Value Gap Width Filter: specifies the filtering multiplier; additional details can be found in the tooltip of the respective input option.
Bullish & Bearish Imbalance: color customization options.
🔹Sessions Tabular View
Sessions Tabular View: toggles the visibility of the tabular view of the sessions, displaying date &time, status, and countdown counter.
Hide if not Forex Market Instrument: checks the market and automatically enables/disables the option based on the market instrument.
Table Text Size & Position: size and placement customization options
🔶 LIMITATIONS
Please be aware that fair value gap filtering cannot be applied to the initial 144 candles (with a fixed-length ATR) as the ATR value necessary for filtering won't be available during this period.
🔶 RELATED SCRIPTS
Buyside-Sellside-Liquidity
Sessions
Liquidity-Voids-FVG
Thank you to our community for the recommendation of this script. To explore additional conceptual scripts and related content, we invite you to visit >>> LuxAlgo-Scripts .

skThis Pine Script is an indicator designed to mark and highlight specific trading sessions on a TradingView chart. Here's a description of the script's functionality:
1. *Session Selection*: The script allows you to select a session time frame using the `session_input` input. The available options for session time frames are "D" (daily), "W" (weekly), "M" (monthly), "H" (hourly), "15" (15 minutes), "5" (5 minutes), and "1" (1 minute).
2. *Session Times*: You can specify the start and end times for three different trading sessions - CBDR (Central Bank Dealer Range), Asia, and London - using the corresponding input options. These times are specified in Indian Standard Time (IST).
3. *Time Calculation*: The script calculates the start and end times for each session based on the specified hours and minutes. It uses the `timestamp` function to create time objects for these sessions.
4. *Session Highlighting*: The script creates rectangles on the chart to highlight each session:
- CBDR Session: A gray rectangle is drawn during the CBDR session time.
- Asia Session: Another gray rectangle is drawn during the Asia session time.
- London Session: A green rectangle is drawn at the top of the chart during the London session time.
5. *Transparency*: The rectangles have a transparency level of 90%, allowing you to see the price data beneath them while still marking the sessions.
6. *Overlay*: The indicator is set to overlay on the price chart, so it doesn't obstruct the price data.
7. *Customization*: You can customize the session times and appearance by adjusting the input values in the settings panel of the indicator.
Overall, this script provides a visual way to identify and highlight specific trading sessions on your TradingView chart, helping traders understand price action in different market sessions.

Supply And DemandThis supply and demand indicator uses sessions, volume spikes, higher timeframe price action and other volume calculations to spot areas on the chart where price will likely react. From the 1 minute and below charts to the daily and up charts, you can get excellent levels for any timeframe.
Why Use Supply And Demand?
One of the safest ways to trade is to wait for price to enter an area of interest where price should react. When we play reversals off of these areas, you increase the likelihood that your trade will be profitable because there was previous price action that told you that the current level is one where price will react. So we look for reversals at or very near these levels to enter into scalp or swing trade positions and look to exit that position when price is at or near the next major supply and demand level.
How To Use
The strategy with this indicator is to wait for price action to reach the levels shown by this supply and demand indicator and then enter trades at these levels, looking for a reversal. The thicker lines and the lines that are from the highest timeframes will be the most important levels on the chart. There is a table on the chart that will help you identify what timeframe the levels are using, with the color of that line next to it for easy identification.
The default settings are designed for scalping the 1-5 minute charts, so there are more levels turned on than necessary if you are using higher timeframes than 5 minutes. If you are using higher timeframes, make sure to turn off some of the lower timeframe levels so that it doesn’t clog up your charts. On the daily timeframe and above, many of the levels are coded to not turn on so that you don’t have to turn them off manually, but be aware that you will need to adjust your charts to suit your preferences, especially if you are on anything above the 5 minute chart.
For scalping, wait for price to react from the supply and demand levels by showing wicks, struggling to break through or getting reversal candles at those levels. Ride those moves to the next major supply and demand area before taking profit. You may want to turn on sessions and some of the lower timeframe levels as well if there are big gaps on the chart that are not suitable for scalping.
For swing trading, you will want to turn some of the lower timeframe and session levels off. Leave it to only higher timeframe OHLC lines and volume spike levels. Then you can swing moves that reverse off of the supply and demand lines.
Customization
This indicator is fully customizable. You can turn on or off any of the levels as well as increase the number specific levels so your charts suit your preferences.
All of the levels used are color coded individually so you can easily tell which type of level it is and these colors can be changed within the settings to suit your preferences. These colors are also reflected in the line identification table that show you exactly which color each type of level is.
There are toggles for the line identification table and session identification table as well if you don’t want them on your chart.
Types Of Levels Used
This indicator uses 4 different types of levels that I have found to be extremely influential on the price action. They are: volume spikes, higher timeframe price action, country based trading sessions and the VWAP. All of these levels have proven to be very important levels in my testing and are very helpful in spotting reversal areas.
Volume Spikes
This indicator is looking for the largest volume spikes and plotting the levels where that volume came in. It checks for the highest volume spikes across multiple different lengths of candles so that you get recent levels as well as the most important levels in the past. There are volume spike calculations for your current chart timeframe, 1 hour charts, 4 hour charts, daily charts, weekly charts, and monthly charts. Each of these looks for volume spikes across various lengths of candles for each timeframe and is color coded so you can identify which levels are which easily. The weekly and monthly volume spike levels are fatter than the normal volume spike levels with a line width of 2 to signify their importance.
OHLC Higher Timeframe Candles
This script plots levels of higher timeframe candles since price usually reacts very strongly to these levels. The levels it will produce are the high, low, open and close of the most recent closed candle of each higher timeframe. You can adjust these to show as many or as few previous HTF candles as you would like. The higher timeframe candles available to use are as follows: 1 hour, 4 hour, daily, 3 day, weekly, monthly, quarterly and yearly. The monthly, quarterly and yearly levels are fatter than the normal levels with a line width of 2 to signify their importance.
Trading Sessions
Trading sessions are very important levels because the market makers of different parts of the world are typically positioning themselves at these specific times. The number of each trading session line can be adjusted to show more or less levels depending on your preference. When you adjust the number, it will affect all lines that are enabled for that specific session. The levels available for each Tokyo, London & New York session are as follows: session premarket open, regular session open, session close, and session high & low. The session close boxes are fatter than the others with a line width of 2 to signify its importance.
VWAP & Previous Close
We all know that the VWAP aka Volume Weighted Average Price is a very important level on any chart, so we included this level as a default. However, we decided to take this a step further and include the previous daily session’s VWAP closing price and plot those levels. These are extremely important levels that you should pay very close attention to, along with the other levels mentioned above. The market makers are hedging their positions based on these levels and you will typically see very strong reactions to these levels, especially in the first hour when the markets open up. The VWAP and previous session VWAP close levels can be turned on or off and the default for the number of previous VWAP session close prices is set to 5. These levels are fatter lines because they are extremely important, so make sure to pay attention to them!
Line & Session Identification Tables
There are two tables to help you identify what is on the chart. The first is a large table in the top right that shows you the color and type of each line that is turned on so you can easily identify which lines are which. The second table is a small one at the bottom center of the chart that tells you which trading session we are currently in and what color that session is on the chart. These tables can be turned on or off and you can also change where they are on the chart by adjusting them at the bottom of the settings page.
Markets
This Supply And Demand indicator can be used on any market with price data such as stocks, crypto, forex and futures.
Timeframes
This Supply And Demand indicator can be used on any timeframe, from the second charts all the way up to the yearly charts.
